

| 世界の保育・幼児教育の状況を理解するために、各国の背景事情の把握は欠かせません。ここでは、その国の人口規模・教育投資などの基礎的な情報から教育制度に至るまでを、就学前の時期を中心にご紹介します。世界の保育・幼児教育に関心のある読者の皆さまの参考になれば幸いです。 |
1. 首都:アムステルダム
2. 人口:16 844 000 (2015)
3. 公用語:オランダ語
4. 通貨:ユーロ (EUR)
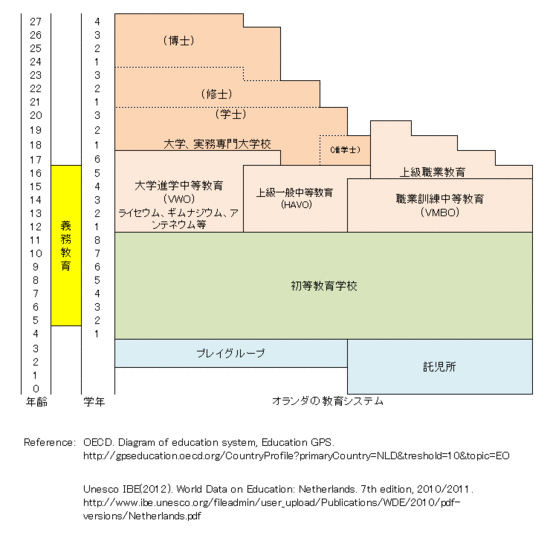
5. 教育および保育の制度
- 学制:就学前教育(2歳から3歳)、小学校(4歳から11歳)、中等教育(12歳から)、高等教育(17/18歳から)
- 管轄省庁:教育科学文化省、社会雇用省(保育を管轄)
- 義務教育:5歳から16歳
- ほぼ全ての子どもが4歳で小学校に入学する。また、18歳以下の若者は基礎的な資格を取るまで在学することが義務付けられている。
- 3歳:83% (2012)
- 4歳:100% (2012)
- 5歳:100% (2012)
- 6歳:100% (2012)
- 就学前:0.4% (2011)
- 初等・中等・高等教育以外の中等後教育:3.8% (2011)
- 全教育段階:5.9% (2011)
- 初等教育:23 (2012)
- 就学前:16 (2012)
- 初等教育:16 (2012)
- PISA 2012: 数学-10、読解-15、科学-14
- TIMSS 2011(4年生): 数学-12、科学-14
※画像をクリックすると拡大表示されます。
-
Reference 参考資料
- 2. Population Division, United Nations. World Population Prospects: The 2012 Revision.
http://esa.un.org/unpd/wpp/unpp/panel_population.htm. - 5. OECD. Diagram of education system, Education GPS.
http://gpseducation.oecd.org/CountryProfile?primaryCountry=NLD&treshold=10&topic=EO. - Unesco-IBE. World Data on Education, 7th edition 2010/2011 (2012).
http://www.ibe.unesco.org/fileadmin/user_upload/Publications/WDE/2010/pdf-versions/Italy.pdf. - The Netherlands Youth Institute. Early childhood services.
http://www.youthpolicy.nl/yp/Youth-Policy/Youth-Policy-subjects/Early-childhood-services. - 6. OECD (2014). Education at a Glance 2014: OECD Indicators, OECD Publishing.
http://dx.doi.org/10.1787/eag-2014-en. Table C2.1 Enrolment rates in early childhood and primary education, by age (2005, 2012). http://dx.doi.org/10.1787/888933118333. - 7. OECD (2014). Education at a Glance 2014: OECD Indicators, OECD Publishing.
http://dx.doi.org/10.1787/eag-2014-en. Table B4.1. Total public expenditure on education (2011). http://dx.doi.org/10.1787/888933117573. - 8. OECD (2014). Education at a Glance 2014: OECD Indicators, OECD Publishing.
http://dx.doi.org/10.1787/eag-2014-en. Table D2.1. Average class size, by type of institution and level of education (2012). http://dx.doi.org/10.1787/888933119682. - 9. OECD (2014). Education at a Glance 2014: OECD Indicators, OECD Publishing.
http://dx.doi.org/10.1787/eag-2014-en. Table D2.2. Ratio of students to teaching staff in educational institutions (2012). http://dx.doi.org/10.1787/888933119682. - 10. OECD (2013). PISA 2012 RESULTS IN FOCUS. Snapshot of performance in mathematics, reading and science. http://www.oecd.org/pisa/keyfindings/pisa-2012-results-snapshot-volume-I-ENG.pdf.
- Martin, M.O., Mullis, I.V.S., Foy, P., & Arora, A. (2012).The TIMSS 2011 International Results in Mathematics. Chestnut Hill, MA: TIMSS & PIRLS International Study Center, Boston College. http://timssandpirls.bc.edu/timss2011/downloads/T11_IR_M_Chapter1.pdf, p.40.
- Martin, M.O., Mullis, I.V.S., Foy, P., & Stanco, G.M. (2012). The TIMSS 2011 International Results in Science. Chestnut Hill, MA: TIMSS & PIRLS International Study Center, Boston College. http://timss.bc.edu/timss2011/downloads/T11_IR_S_Chapter1.pdf, p.38.